Blueprint #6: Industrial Observability & Digital Twin Architecture
1. Introduction
Why Observability is Critical in Industrial Systems
Modern industrial systems are no longer isolated, deterministic environments.
They are complex, distributed ecosystems composed of edge devices, streaming pipelines, AI models, and cloud-native platforms.
In such environments, traditional monitoring is not enough.
Industrial operations require the ability to:
- Understand system behavior in real time
- Detect anomalies before failures occur
- Correlate events across multiple layers (OT + IT)
- Diagnose root causes quickly and accurately
This is where Observability becomes essential.
Observability goes beyond simple metrics and dashboards.
It enables deep visibility into system states by combining:
- Metrics (performance indicators, OEE, latency)
- Logs (system and application events)
- Traces (end-to-end data flow across services)
In a smart factory, observability is not optional —
it is the foundation for reliability, efficiency, and safety.
From Monitoring → Observability → Autonomous Factory
Industrial systems are evolving through three distinct stages:
1. Monitoring (Reactive)
- Basic dashboards and alerts
- Threshold-based detection
- Manual intervention required
2. Observability (Proactive)
- Real-time insights across systems
- Correlation of metrics, logs, and events
- Faster root cause analysis (RCA)
- Integration with streaming and AI systems
3. Autonomous Factory (Predictive & Self-Optimizing)
- AI-driven anomaly detection
- Predictive maintenance
- Automated decision-making and control loops
- Self-healing systems
The transition from monitoring to observability marks a critical shift:
from reacting to failures → understanding systems → preventing failures.
Ultimately, this evolution leads to the realization of the Autonomous Factory,
where systems can optimize themselves with minimal human intervention.
Role of Digital Twin in Smart Manufacturing
A Digital Twin is a virtual representation of a physical system that is continuously synchronized with real-world data.
In industrial environments, digital twins enable:
- Real-time visualization of factory operations
- Simulation of production scenarios before execution
- Predictive analysis based on historical and live data
- Optimization of processes without disrupting physical systems
The Digital Twin acts as a bridge between:
- Physical World (Machines, Sensors, Production Lines)
- Digital World (Data, Models, Simulation Engines)
When combined with observability, digital twins unlock powerful capabilities:
- Simulate anomalies before they occur
- Validate optimization strategies in a virtual environment
- Enable closed-loop feedback systems
This transforms industrial systems from data-driven → simulation-driven → decision-driven.
End-to-End Context: Connecting Blueprint #1 ~ #5
Blueprint #6 does not exist in isolation.
It is the culmination of the entire Industrial IoT architecture.
Each previous blueprint contributes a critical layer:
Blueprint #1 – Data Pipeline Architecture
→ Provides reliable data ingestion and storageBlueprint #2 – Streaming Architecture
→ Enables real-time data flow and event-driven processingBlueprint #3 – AI Platform Architecture
→ Delivers machine learning models for prediction and analyticsBlueprint #4 – Computer Vision Architecture
→ Adds visual intelligence for inspection and quality controlBlueprint #5 – MLOps & Edge Deployment Architecture
→ Operationalizes AI models across edge and cloud environments
Blueprint #6 integrates all of these layers into a unified system:
Observability + Digital Twin = System Awareness + System Intelligence
This is where the architecture evolves from:
- Building systems → Understanding systems → Optimizing systems
And ultimately:
From Industrial Automation → To Autonomous Manufacturing
2. Architecture Overview
2-1 High-Level Observability + Digital Twin Architecture
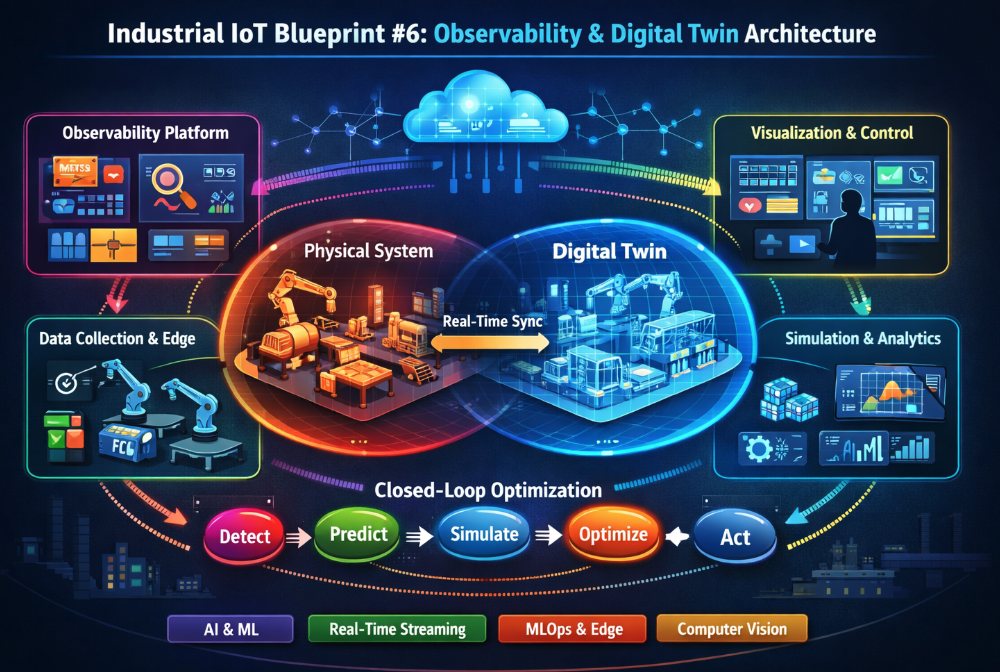
The Industrial Observability and Digital Twin architecture provides a unified framework for monitoring, simulation, and control across the entire smart factory ecosystem.
Unlike traditional architectures that separate monitoring and operational systems, this approach tightly integrates:
- Real-time data collection from physical assets
- Centralized observability platforms for system insight
- Digital twin environments for simulation and prediction
- Control systems for automated or human-in-the-loop actions
This architecture enables a continuous flow of data and feedback across all layers, forming a closed-loop operational model.
At a high level, the system is composed of four primary layers:
2-2 Key Layers
A. Data Collection Layer
This layer is responsible for capturing raw data from industrial environments.
Sources include:
- Sensors (temperature, pressure, vibration, etc.)
- PLCs and industrial equipment
- Edge devices and gateways
- Application logs and system events
- Metrics from infrastructure and services
Key characteristics:
- High-frequency data ingestion
- Support for structured and unstructured data
- Edge preprocessing and filtering
- Protocol support (MQTT, OPC-UA, Modbus, HTTP)
This layer forms the foundation for both observability and digital twin synchronization.
B. Observability Platform Layer
This layer aggregates, processes, and analyzes data to provide deep visibility into system behavior.
Core capabilities:
- Metrics aggregation (time-series data)
- Log collection and indexing
- Distributed tracing across services
- Event correlation and anomaly detection
Typical components:
- Time-series databases
- Log management systems
- Stream processing engines
- Alerting and incident response systems
The observability platform transforms raw data into actionable insights, enabling engineers to understand system performance and detect issues in real time.
C. Digital Twin Simulation Layer
This layer creates and maintains virtual representations of physical systems.
Core functions:
- Real-time state synchronization with physical assets
- Simulation of production processes and scenarios
- Predictive modeling and what-if analysis
- Integration with AI/ML models for advanced forecasting
Key elements:
- Simulation engines
- Physics-based or data-driven models
- State management systems
- Scenario orchestration tools
By mirroring real-world operations, this layer enables safe experimentation and optimization without impacting actual production.
D. Visualization & Control Layer
This layer provides interfaces for monitoring, decision-making, and system control.
Capabilities include:
- Real-time dashboards and system views
- Digital twin visualization (3D / process-level)
- Alerting and notification systems
- Control interfaces for operators and automation systems
Control mechanisms:
- Manual operator intervention
- Rule-based automation
- AI-driven control loops
This layer closes the loop by enabling actions based on insights and simulations, ensuring continuous optimization of industrial operations.
2-3 Architecture Flow Summary
The interaction between layers can be summarized as:
- Physical systems generate data
- Data is collected and processed in real time
- Observability platforms analyze system behavior
- Digital twins simulate and predict outcomes
- Insights drive visualization and control decisions
- Actions are fed back into the physical system
This architecture establishes a seamless connection between data, insight, simulation, and action,
forming the backbone of intelligent and adaptive industrial systems.
3. Industrial Observability Stack
The Industrial Observability Stack is designed to provide deep, real-time visibility into complex and distributed industrial systems.
It enables engineers and operators to move beyond isolated monitoring signals and instead understand how systems behave as a whole.
This stack is built on four foundational pillars:
3-1. Metrics (Time-Series)
Metrics represent numerical measurements collected over time and are essential for tracking system performance and health.
Examples:
- Equipment performance (OEE, throughput)
- Resource utilization (CPU, memory, network)
- Sensor readings (temperature, pressure, vibration)
- Latency and response times
Key characteristics:
- High-frequency, time-series data
- Efficient storage and querying
- Aggregation and downsampling for scalability
Metrics provide a quantitative view of system behavior and are typically the first signal used for detecting abnormalities.
3-2. Logs (Structured / Unstructured)
Logs capture discrete events generated by systems, applications, and devices.
They provide detailed contextual information that is not available in metrics.
Types of logs:
- Structured logs (JSON, key-value pairs)
- Unstructured logs (plain text, system outputs)
Common sources:
- Edge devices and gateways
- Application services
- Industrial control systems
- Security and access logs
Logs are essential for:
- Debugging issues
- Auditing system behavior
- Understanding event sequences
3-3. Traces (Distributed Systems)
Traces track the flow of data and requests across distributed components.
In industrial systems, this includes interactions between:
- Edge devices
- Streaming platforms
- AI inference services
- Cloud applications
Capabilities:
- End-to-end visibility across services
- Latency breakdown per component
- Identification of bottlenecks and failures
Distributed tracing is critical for understanding complex workflows where a single operation spans multiple systems.
3-4. Event Correlation
Event correlation connects signals from metrics, logs, and traces to provide a unified view of system behavior.
Instead of analyzing data in isolation, this approach enables:
- Linking anomalies across different data sources
- Identifying cascading failures
- Accelerating root cause analysis (RCA)
Example: A spike in vibration (metric) → followed by error logs → leading to a failed inference pipeline (trace)
By correlating these events, the system can quickly identify the root cause and trigger appropriate actions.
3-5. Core Components
To implement an effective observability stack, several key components are required:
A. Edge Monitoring Agents
These agents run on edge devices, gateways, or industrial equipment.
Responsibilities:
- Collect metrics, logs, and traces locally
- Perform lightweight preprocessing and filtering
- Reduce data volume before transmission
- Ensure reliable data delivery in constrained environments
Edge monitoring is essential for low-latency and resilient observability in industrial settings.
B. Central Observability Platform
This platform aggregates and processes observability data from across the system.
Typical technologies:
- Metrics: Prometheus
- Visualization: Grafana
- Logs: ELK Stack (Elasticsearch, Logstash, Kibana)
- Tracing: OpenTelemetry / Jaeger
Core functions:
- Data ingestion and storage
- Query and analysis
- Dashboard creation and visualization
- Integration with streaming and AI systems
This layer serves as the single source of truth for system observability.
C. Alerting & Incident Management
This component ensures that critical issues are detected and addressed in a timely manner.
Key features:
- Rule-based and dynamic alerting
- Threshold and anomaly-based triggers
- Notification channels (Slack, email, SMS, etc.)
- Incident tracking and escalation workflows
Advanced capabilities:
- AI-driven alert prioritization
- Noise reduction and alert deduplication
- Integration with automation systems
Effective alerting transforms observability data into actionable responses.
3-6. Summary
The Industrial Observability Stack combines multiple data types and system components to provide comprehensive visibility into industrial operations.
By integrating metrics, logs, traces, and event correlation, organizations can:
- Detect issues earlier
- Diagnose problems faster
- Improve system reliability and performance
Observability is not just about collecting data —
it is about transforming data into understanding, insight, and action.
4. Real-Time Monitoring & Anomaly Detection
Modern industrial systems require continuous, real-time awareness of operational conditions.
This is achieved through streaming-based monitoring combined with intelligent anomaly detection.
4-1. Streaming-Based Real-Time Monitoring
Real-time monitoring is powered by streaming architectures that process data as it is generated.
Key characteristics:
- Continuous ingestion of sensor and system data
- Low-latency processing pipelines
- Event-driven detection and response
- Scalability across distributed environments
Typical data sources:
- Industrial sensors (vibration, temperature, pressure)
- Machine telemetry and equipment signals
- Application and infrastructure metrics
- Production line events
Streaming systems enable immediate visibility into system states, allowing operators to react without delay.
4-2. AI-Based Anomaly Detection
Traditional rule-based monitoring is limited in complex environments.
To overcome this, AI models are used to detect patterns and anomalies that are not easily defined by static thresholds.
Connected architectures:
- Blueprint #3 (AI Platform): model training and lifecycle management
- Blueprint #5 (MLOps & Edge): model deployment and real-time inference
Capabilities:
- Detection of subtle deviations and early warning signals
- Adaptive models that evolve with system behavior
- Reduction of false positives compared to rule-based systems
AI-driven anomaly detection enables proactive identification of issues before they escalate into failures.
4-3. Predictive Maintenance
Predictive maintenance leverages real-time data and AI models to anticipate equipment failures.
Key benefits:
- Reduced unplanned downtime
- Optimized maintenance schedules
- Extended equipment lifespan
- Lower operational costs
Typical approach:
- Monitor equipment condition in real time
- Detect anomalies or degradation patterns
- Predict remaining useful life (RUL)
- Schedule maintenance before failure occurs
This shifts maintenance strategies from reactive or preventive to predictive and optimized.
4-4. Key Concepts
A. Threshold-Based Monitoring vs ML-Based Detection
| Approach | Characteristics |
|---|---|
| Threshold-Based | Simple rules, static limits, easy to implement but limited adaptability |
| ML-Based Detection | Learns patterns from data, adaptive, better for complex systems |
Modern industrial systems typically use a hybrid approach, combining both methods for robustness.
B. KPI / OEE Monitoring
Key Performance Indicators (KPIs) and Overall Equipment Effectiveness (OEE) are essential for evaluating operational efficiency.
Common KPIs:
- Availability
- Performance
- Quality
Real-time KPI monitoring enables continuous performance tracking and immediate response to deviations.
C. Root Cause Analysis (RCA)
RCA focuses on identifying the underlying cause of issues rather than just addressing symptoms.
Enabled by:
- Correlated observability data (metrics, logs, traces)
- Event timelines and dependency tracking
- AI-assisted analysis
Effective RCA significantly reduces mean time to resolution (MTTR) and improves system reliability.
5. Digital Twin Architecture
The Digital Twin Architecture provides a virtual representation of physical industrial systems, enabling real-time synchronization, simulation, and optimization.
5-1. What is a Digital Twin?
A Digital Twin is a dynamic, data-driven model that mirrors the state and behavior of a physical system.
It continuously integrates data from real-world operations to maintain an up-to-date virtual counterpart.
5-2. Physical ↔ Virtual Synchronization
The core of a digital twin lies in seamless synchronization between the physical and digital environments.
Data flow includes:
- Sensor data from machines and production lines
- Operational states and system conditions
- Historical and contextual data
This synchronization ensures that the digital twin reflects real-world conditions with high fidelity.
5-3. Real-Time State Mirroring
Real-time state mirroring allows the digital twin to replicate current system conditions as they evolve.
Capabilities:
- Live system visualization
- Continuous state updates
- Immediate reflection of changes in the physical system
This enables operators and systems to observe and analyze operations without direct interaction with physical assets.
5-4. Core Layers
A. Physical Layer (Factory / Equipment)
This layer consists of all real-world industrial assets:
- Machines and production lines
- Sensors and control systems
- Robotics and automation equipment
It is the source of truth for operational data.
B. Data Synchronization Layer
This layer connects the physical and digital worlds.
Responsibilities:
- Real-time data ingestion and streaming
- Data normalization and transformation
- State synchronization across systems
It ensures consistency and reliability of data used by the digital twin.
C. Simulation & Modeling Layer
This layer enables advanced analysis and experimentation.
Functions:
- Process simulation and scenario testing
- Physics-based or data-driven modeling
- Integration with AI/ML models
It allows organizations to evaluate decisions before applying them in real environments.
D. Feedback Loop Layer
This layer closes the loop between simulation and real-world operations.
Capabilities:
- Translating simulation insights into actionable decisions
- Sending control signals back to systems
- Enabling automated or semi-automated optimization
This transforms the digital twin from a passive model into an active component of industrial control systems.
5-5. Summary
Real-time monitoring and digital twin technologies work together to provide both visibility and predictive capability.
- Monitoring detects and analyzes current system states
- Digital twins simulate and optimize future outcomes
Together, they enable industrial systems to evolve from reactive operations
to predictive and intelligent decision-making systems.
6. Closed-Loop Optimization
Closed-loop optimization represents the transition from insight to action in industrial systems.
It enables continuous improvement by connecting detection, prediction, simulation, and control into a unified operational cycle.
6-1. Detect → Predict → Simulate → Optimize → Act
At the core of closed-loop optimization is a continuous feedback cycle:
- Detect
- Real-time monitoring identifies anomalies and performance deviations
- Observability systems capture metrics, logs, and events
- Predict
- AI/ML models forecast future states and potential failures
- Predictive analytics estimate trends such as equipment degradation
- Simulate
- Digital twins evaluate different scenarios in a virtual environment
- What-if analysis is performed without impacting physical systems
- Optimize
- The best strategy is selected based on simulation results
- Trade-offs between cost, performance, and risk are evaluated
- Act
- Decisions are executed through control systems
- Actions are applied either automatically or with human approval
This loop continuously refines system performance, enabling adaptive and intelligent operations.
6-2. Autonomous Control Systems
Closed-loop optimization enables the development of autonomous control systems that can operate with minimal human intervention.
Key characteristics:
- Real-time decision-making based on live data
- Integration with AI inference and rule-based systems
- Self-adjusting parameters and control strategies
- Continuous learning from operational feedback
Control modes:
- Human-in-the-loop (operator-assisted decisions)
- Semi-autonomous (system recommendations with approval)
- Fully autonomous (self-executing control loops)
Autonomous control systems significantly improve responsiveness and operational efficiency.
6-3. Edge + Cloud Collaboration
Efficient closed-loop systems require seamless collaboration between edge and cloud environments.
Edge responsibilities:
- Low-latency data processing
- Real-time inference and control
- Immediate response to critical events
Cloud responsibilities:
- Large-scale data storage and analytics
- Model training and optimization
- Global system coordination
Hybrid architecture benefits:
- Reduced latency for time-critical operations
- Scalability for large industrial deployments
- Balanced computational load across environments
This distributed approach ensures both speed and scalability in optimization workflows.
6-4. Use Cases
A. Production Optimization
- Dynamic adjustment of production parameters
- Bottleneck identification and resolution
- Throughput maximization with minimal downtime
B. Energy Efficiency Improvement
- Monitoring and optimizing energy consumption
- Load balancing across systems
- Reducing waste and operational costs
C. Automated Quality Control
- Real-time defect detection and correction
- Integration with computer vision systems
- Continuous calibration of production processes
6-5. Summary
Closed-loop optimization transforms industrial systems into adaptive and self-improving environments.
By integrating observability, AI, and digital twin technologies, organizations can:
- Continuously improve operational performance
- Reduce downtime and inefficiencies
- Enable intelligent, automated decision-making
Closed-loop optimization is the foundation of the Autonomous Factory,
where systems not only understand and predict — but also act and improve continuously.
7. Integration with Previous Blueprints
Blueprint #6 serves as the final integration layer that brings together all previous architectural components into a unified, intelligent system.
Rather than introducing a new isolated system, this blueprint connects and operationalizes the capabilities developed across Blueprint #1 to #5.
7-1. Blueprint #1 – Data Pipeline Architecture
The data pipeline provides the foundational layer for observability.
Role in Blueprint #6:
- Supplies structured and reliable data for monitoring systems
- Enables historical analysis and long-term trend detection
- Feeds both observability platforms and digital twin environments
Without a robust data pipeline, observability lacks consistency and completeness.
7-2. Blueprint #2 – Streaming Architecture
The streaming layer enables real-time data flow across the system.
Role in Blueprint #6:
- Powers real-time monitoring and alerting
- Supports event-driven anomaly detection
- Ensures low-latency data delivery to digital twin systems
Streaming is the backbone of real-time observability and closed-loop feedback.
7-3. Blueprint #3 – AI Platform Architecture
The AI platform introduces intelligence into the system.
Role in Blueprint #6:
- Provides models for anomaly detection and prediction
- Enables predictive maintenance and forecasting
- Supports decision-making through advanced analytics
This layer transforms raw observability data into actionable insights.
7-4. Blueprint #4 – Computer Vision Architecture
The computer vision layer adds visual intelligence to industrial systems.
Role in Blueprint #6:
- Enables real-time visual inspection and defect detection
- Provides additional data signals for observability
- Feeds quality-related insights into digital twin simulations
This enhances system awareness beyond traditional sensor data.
7-5. Blueprint #5 – MLOps & Edge Deployment Architecture
MLOps ensures that AI models are continuously deployed, monitored, and improved.
Role in Blueprint #6:
- Operationalizes AI models in real-time environments
- Enables edge-based inference for low-latency decision-making
- Supports continuous model updates and performance monitoring
This ensures that intelligence remains accurate and up-to-date across the system.
7-6. Unified Architecture Perspective
When combined, Blueprint #1 to #5 create a complete industrial data and intelligence pipeline:
- Data is collected and processed
- Events are streamed in real time
- AI models generate predictions
- Visual systems enhance perception
- Models are deployed and maintained continuously
Blueprint #6 integrates all of these into a cohesive system that can:
- Monitor system behavior in real time
- Understand and predict system states
- Simulate and optimize decisions
- Execute actions through control systems
8. Real-World Use Cases
The combination of observability and digital twin technologies enables a wide range of real-world industrial applications.
8-1. Smart Factory Operations Center
A centralized operations center provides a unified view of the entire factory.
Capabilities:
- Real-time monitoring of production lines and equipment
- Integrated dashboards for KPIs, alerts, and system health
- Cross-layer visibility (OT + IT systems)
This enables operators to make faster and more informed decisions.
8-2. Semiconductor Fab Monitoring
Semiconductor manufacturing requires extremely high precision and stability.
Applications:
- Monitoring of cleanroom environments (temperature, humidity, vibration)
- Equipment health tracking and anomaly detection
- Process consistency validation through digital twins
Even minor deviations can significantly impact yield, making observability critical.
8-3. Energy Optimization System
Industrial facilities consume significant amounts of energy.
Use cases:
- Real-time energy consumption monitoring
- Load balancing across machines and production lines
- Simulation of energy-saving strategies using digital twins
This leads to reduced operational costs and improved sustainability.
8-4. Predictive Maintenance at Scale
Predictive maintenance can be applied across thousands of assets.
Key benefits:
- Early detection of equipment degradation
- Reduced unplanned downtime
- Optimized maintenance scheduling
By scaling predictive models across the factory, organizations achieve higher reliability and efficiency.
8-5. Future of Industrial Systems
Industrial systems are evolving toward fully autonomous and self-optimizing environments.
8-6. Autonomous Factory (Self-Healing Systems)
Future factories will operate with minimal human intervention.
Characteristics:
- Automatic detection and resolution of issues
- Self-adjusting control parameters
- Continuous optimization of production processes
These systems are often referred to as self-healing systems.
8-7. AI + Digital Twin Convergence
The integration of AI and digital twin technologies will redefine industrial operations.
Key trends:
- AI-driven simulation and decision-making
- Continuous learning from real-world data
- Closed-loop optimization at scale
This convergence enables systems to not only simulate reality but also improve it.
8-8. Simulation-Driven Manufacturing
Manufacturing processes will increasingly rely on simulation before execution.
Approach:
- Validate production strategies in digital environments
- Optimize processes without physical trial-and-error
- Reduce risks and improve efficiency
Simulation becomes a core component of decision-making rather than a supplementary tool.
8-9. Final Thoughts
–> The Industrial IoT architecture has evolved into a fully integrated system that connects data, intelligence, and action.
8-10. From Data → Intelligence → Autonomy
This blueprint series illustrates a clear progression:
- Data → Collected and processed through pipelines and streaming systems
- Intelligence → Generated through AI platforms and analytics
- Autonomy → Achieved through observability, digital twins, and closed-loop optimization
This transformation represents the future of industrial systems.
8-11. The Final Stage of Industrial IoT Architecture
Blueprint #6 represents the culmination of the entire architecture.
It brings together all components into a system capable of:
- Understanding its current state
- Predicting future conditions
- Simulating optimal strategies
- Acting on decisions automatically
8-12. Architect Perspective: Key Takeaways
- Observability is the foundation for system awareness
- Digital twins enable simulation and optimization
- AI provides predictive and adaptive intelligence
- Closed-loop systems enable continuous improvement
Together, these elements form a complete architecture for next-generation industrial systems.
9. Core Positioning (Important)
Blueprint #6 is not just another architectural layer —
it is the control tower of the entire Industrial IoT system.
9-1. Architecture Perspective
- Blueprint #1 ~ #5 → Build the System
- Blueprint #6 → Operate, Optimize, and Automate the System
9-2. Strategic Value
This blueprint enables organizations to move beyond traditional automation:
- From reactive operations → proactive optimization
- From isolated systems → fully integrated architecture
- From human-driven control → autonomous systems
Blueprint #6 defines the transition from industrial automation
to autonomous manufacturing systems.
Blueprint #6 transforms individual architectural components into a fully integrated system
capable of awareness, intelligence, and autonomous operation.